Marketplace profit depends on category, price band, fulfilment, parcel and returns. This guide builds a reusable calculator that uses current official fee inputs instead of hard-coded rates.
Updated 24 August 2026 · Practical guide for Indian product businesses
Build the calculator around a SKU and fulfilment route
A marketplace profit calculator should answer whether one SKU, at one selling price and fulfilment route, produces contribution after variable costs. Amazon’s official seller page groups charges into referral, closing, shipping or weight handling and other applicable fees. Flipkart’s official fee page describes fixed, commission, shipping and collection fees. Both vary by operating details.
This article is a calculation layer beneath the marketplace versus own-store profit checklist. It does not publish a permanent fee table because marketplace rates and conditions can change. Use the current official dashboard or calculator at the time of each decision.
Calculator key
Why it matters
Example distinction
Marketplace
Fee names and rules differ
Amazon versus Flipkart
Category
Commission or referral can vary
Correct mapped category
Price band
Fixed fees may change
Threshold crossing
Fulfilment route
Shipping and service costs change
Platform fulfilment versus seller ship
Packed weight and distance
Delivery cost changes
Local, regional or national
Use realised revenue, not MRP
Start with the selling price actually paid and separate any discount funded by the seller, marketplace or both. Decide whether the calculator is tax-inclusive or tax-exclusive and match it to settlement records. Collected tax is not the same as business revenue, so have an accountant confirm the correct treatment.
Revenue line
Record
Common error
Listed selling price
Customer-facing price
Using MRP instead of transaction value
Seller-funded discount
Reduces seller economics
Treating every promotion as platform-funded
Marketplace-funded benefit
Confirm settlement treatment
Assuming funding without statement evidence
Shipping income if any
Include only when realised
Counting a displayed charge not received
Net realised revenue
Settlement-compatible basis
Mixing tax-inclusive and tax-exclusive numbers
The product pricing guide helps connect marketplace price with the cost and control of other channels.
Enter current fee components separately
Do not enter one “marketplace fee percentage.” Percentage charges, fixed charges and fulfilment charges behave differently when price or weight changes. Save the source, effective date and fee basis beside every input.
Fee family
Possible basis
Verification source
Commission or referral
Category and selling price
Current official fee schedule
Fixed or closing fee
Price band and fulfilment
Official calculator or dashboard
Shipping or weight handling
Weight, dimensions and distance
Fulfilment-rate input
Collection or payment
Payment mode or selling value
Marketplace statement
Optional services
Programme use
Service enrolment and invoice
Tax on fees
Applicable fee tax treatment
Settlement and accountant
Amazon and Flipkart both state that fees vary. Treat the official pages linked in Sources as the starting point, then use the seller dashboard for SKU-specific decisions.
Add costs the marketplace does not know
The platform fee calculator cannot know your landed product cost, inbound freight, label and packaging, warehouse labour, quality failures, working-capital cost or advertising. Add each cost on a per-order basis and keep fixed overhead separate unless the decision requires a fully loaded profit view.
Calculate expected contribution per delivered order
Expected contribution = realised revenue − product cost − marketplace fees − fulfilment and packaging − advertising allocation − expected return and cancellation cost. Calculate before fixed overhead for a contribution view, then add an overhead allocation only if the decision needs fully loaded profit.
Line
Example only
Amount
Realised revenue
Transaction basis
₹1,500
Product and packaging
Seller records
₹700
Marketplace and fulfilment fees
Current input
₹260
Advertising allocation
Agreed method
₹120
Expected return and cancellation cost
Historical probability
₹90
Expected contribution
Revenue minus variable costs
₹330
The numbers are illustrative and are not current fee quotes. Replace them with the exact SKU, category, fulfilment and settlement inputs.
Model cancellations, returns and damaged inventory
Plan from delivered and kept orders, not only placed orders. Different outcomes may leave different fees, shipping costs and inventory value. Build a probability-weighted planning line, then reconcile actual order outcomes after the return window.
Outcome
Revenue effect
Cost effect
Successful delivered order
Realised sale
Normal fees and fulfilment
Pre-dispatch cancellation
No sale
Possible processing or prep cost
Delivery refusal or failed delivery
No realised sale
Forward, reverse and handling impact
Saleable return
Sale reversed
Fees, reverse cost and inspection
Damaged return
Sale reversed and inventory loss
Higher expected value loss
Use SKU-level history. A store-wide return rate can understate the risk of one fragile or fit-sensitive item.
Allocate marketplace advertising without double counting
Calculate both platform-attributed advertising efficiency and total commercial contribution. Decide whether ad spend is allocated to attributed units, all units in the advertised SKU, or a test cohort. Document the choice and do not compare two methods as though they are identical.
View
Calculation
Use
Attributed ad cost per order
Campaign spend ÷ attributed orders
Campaign report
Blended ad cost per sold unit
Total ad spend ÷ all sold units
Business view
Contribution after ads
Pre-ad contribution minus allocation
Scale decision
Break-even ad share
Pre-ad contribution available for ads
Bid and budget boundary
The unit economics guide and Article 96 break-even ROAS method provide the corresponding advertising boundary.
Reconcile the model with marketplace settlements
Expected profit is a planning output. Settlement profit is the audit. Match order IDs to selling price, fee lines, taxes, reversals, claims and payment dates. Differences may reveal category mapping, weight disputes, expired promotions or model omissions.
Export the settlement and order detail for the same period.
Match each order and reversal to the calculator SKU.
Compare expected and actual fee lines.
Investigate material differences by category, price band or fulfilment.
Update the dated input and retain the prior version.
Escalate fee disputes through the marketplace evidence process.
Do not overwrite history. A dated model makes it possible to explain why contribution changed after a fee or fulfilment update.
Compare channels on equivalent economics
A marketplace may have higher variable fees but lower acquisition friction, while an own store may need more marketing and service effort. Compare contribution after all channel-specific costs, cash timing, return behaviour and control, not one commission line.
Create a minimum contribution rate, cash requirement and return tolerance for each SKU. A low-price product may cross a fee band, a heavier pack may raise shipping cost and a promotion may change both price and volume. Recalculate before accepting every platform campaign.
Result
Likely action
Check first
Healthy contribution, stable returns
Maintain or controlled scale
Stock and cash capacity
Positive before ads, negative after ads
Fix campaign or price
Attribution and allocation method
Negative after fee change
Reprice, reconfigure fulfilment or pause
Current official input
High sales, high return loss
Fix product, content or quality
SKU reason codes
Settlement mismatch
Investigate before scaling
Order-level fee evidence
The calculator is useful only when it changes a decision. Review it every settlement cycle and after any fee, price, packaging, fulfilment or return shift.
Frequently asked questions
How do I calculate profit on Amazon or Flipkart?
Start with realised selling revenue, then subtract product cost, marketplace fees, fulfilment, payment or collection charges, advertising, expected returns, packaging and applicable tax effects. Reconcile with the settlement statement.
Which marketplace fees should a seller include?
Include the current category commission or referral fee, fixed or closing fee, shipping or fulfilment fee, collection or payment fee where applicable, optional service fees and taxes on fees.
Why should marketplace fee rates not be hard-coded?
Rates can vary by category, price band, fulfilment route, weight, distance, programme and date. Pull the current input from the official fee page, dashboard or calculator and date the model.
How should returns be included in marketplace profit?
Use expected return and cancellation rates for planning, including forward and reverse shipping, damaged inventory, non-recoverable fees and lost value. Reconcile actual orders after the return window.
Should advertising cost be included per marketplace order?
Yes for product and campaign profitability. Allocate ad spend using an agreed method and keep platform-attributed sales separate from realised settlements.
How often should marketplace profitability be reviewed?
Review settlements every cycle and recalculate after fee, price, weight, fulfilment, tax or return changes. Maintain SKU-level history so a change is visible quickly.
A free-shipping threshold should encourage a reachable extra purchase while leaving enough incremental contribution to fund delivery. This calculator makes that trade-off visible.
Updated 24 August 2026 · Practical guide for Indian product businesses
Define the behaviour and economics of the threshold
A free-shipping threshold asks the customer to reach a minimum basket in exchange for the business paying some or all delivery cost. The target behaviour is an incremental, relevant purchase, not simply a higher displayed order total. The business needs enough extra contribution to fund the subsidy.
Shopify’s current guide recommends considering AOV, shipping cost, gross profit margin and a proposed cart value. Extend that logic with order distribution, parcel weight and incremental contribution from the added items. Use the unit economics guide as the base.
Threshold question
Required input
Decision
Can customers reach it?
Median and common order bands
Choose a realistic gap
Can the business fund it?
Shipping cost and extra contribution
Set subsidy ceiling
Will parcel cost change?
Packed weight and destination mix
Model the new shipment
Does it create profit?
Contribution per visitor and order
Test against baseline
Collect six inputs before calculating
Use recent fulfilled orders outside an unusual promotion. Calculate net merchandise value, order count, median and common order bands, average shipping cost paid by the business, contribution margin on likely add-on products and destination or weight distribution.
Input
Definition
Source
Common order value
Median or high-frequency basket band
Order export
Current AOV
Order revenue ÷ completed orders
Commerce report
Shipping cost
Actual carrier plus sales-linked handling
Carrier invoices
Add-on contribution margin
Contribution ÷ net revenue for likely additions
Product economics
Qualification rate
Orders already above proposed threshold
Historical simulation
Parcel step-up risk
Added cost from weight or dimensions
Packed-rate test
Use the contribution margin calculator for the likely added products, not a store-wide average that may hide low-margin categories.
Calculate the uncovered shipping subsidy
For a proposed threshold, calculate the gap above the baseline basket and multiply it by the contribution margin on the incremental items. Subtract that incremental contribution from the expected shipping subsidy. The remainder is the amount the original order contribution still needs to fund.
Uncovered subsidy = expected shipping cost − (threshold − baseline basket) × incremental contribution margin. A negative result means the estimated incremental contribution exceeds the shipping cost, before other behavioural effects and profit requirements.
Line
Example only
Calculation
Baseline basket
₹1,000
Median or common band
Proposed threshold
₹1,300
Gap of ₹300
Add-on contribution margin
40%
₹120 incremental contribution
Expected shipping cost
₹100
Historical weighted average
Uncovered subsidy
−₹20
₹100 − ₹120
The example does not guarantee profit. It assumes the customer would otherwise place the baseline order and that the added item does not increase shipping cost.
Simulate the threshold across real order bands
A single average hides who already qualifies and who is too far away. Group historical orders into bands, calculate the gap to the threshold and identify relevant products in each gap. Orders already above the threshold receive a subsidy without an AOV change, so include that cost.
Order band
Distance to ₹1,300 threshold
Likely response
Economic question
Below ₹700
More than ₹600
Low likelihood
Threshold may feel irrelevant
₹700 to ₹999
₹301 to ₹600
Selective
Are useful add-ons available?
₹1,000 to ₹1,299
₹1 to ₹300
Highest test group
Does extra contribution fund shipping?
₹1,300 and above
Already qualified
No basket change required
How much automatic subsidy is created?
Shopify also cautions that mean, median and mode can tell different stories. Inspect all three before deciding.
Model destination, weight and COD effects
Average shipping cost may be misleading when national deliveries, remote areas, volumetric weight or COD charges vary widely. Calculate a weighted cost by zone and parcel type or create separate thresholds when the customer experience remains understandable.
Cost driver
Threshold effect
Control
Extra weight
May increase rate band
Pack a realistic qualifying cart
Volumetric size
Light products may still cost more
Use carrier dimensions
Destination zone
Subsidy varies by region
Weighted model or zoned policy
COD fee and refusal
Raises expected cost
Channel-specific calculation
Split shipment
Can double fulfilment cost
Inventory and fulfilment rule
Do not promise a universal threshold if the checkout cannot enforce exclusions or display the correct delivery condition.
Protect contribution on the products that bridge the gap
Customers may add the cheapest item, not the item assumed in the model. Review which products are likely to bridge common gaps and whether their contribution remains healthy after pick, pack and return risk. Recommend relevant additions rather than creating a junk drawer near checkout.
Create gap-based recommendations from compatible products.
Exclude products whose size sharply increases parcel cost when justified.
Prevent uncontrolled stacking with discount codes or gifts.
Calculate contribution after both the product discount and shipping subsidy.
Keep the customer free to pay shipping instead of adding an unwanted item.
Define the primary metric as contribution per visitor or eligible checkout, not threshold uptake. Guard conversion, cancellation, return rate, delivery promise and support contacts. A high qualification rate can be expensive if it mainly subsidises orders that would already have happened.
Simulate several thresholds on historical completed orders.
Choose one with a reachable gap and positive expected economics.
Configure checkout messaging and exclusions accurately.
Run against a stable baseline for enough order volume and a full return window.
Compare conversion, AOV, contribution, shipping cost and returns.
Keep, revise or remove the threshold from combined evidence.
Connect the experiment to the ecommerce launch checklist so checkout, mobile display and fulfilment are tested together.
Use a decision table for proposed thresholds
Candidate
Historical qualification
Estimated extra contribution
Shipping subsidy
Initial decision
Threshold A
High
Low
High
Likely too generous
Threshold B
Moderate
Covers most subsidy
Moderate
Good test candidate
Threshold C
Low
High if reached
Low
May be psychologically distant
No threshold
None
None
Customer-paid or current policy
Baseline
Do not choose the candidate with the highest theoretical contribution if few customers can reasonably reach it. The purpose is a useful trade, not a hidden minimum purchase.
Review the threshold when economics move
Carrier rates, product mix, packing, prices and customer geography change. Keep a dated input sheet and recalculate after a material change. Reconcile expected shipping with carrier invoices and expected add-on contribution with actual qualifying carts.
Monitor threshold messaging as carefully as the number. The product page, cart drawer, checkout and support team should describe qualification on the same merchandise-value basis and apply the same exclusions. Record customer complaints about unexpected shipping because they often reveal configuration drift.
If the threshold is displayed on product pages, cart, WhatsApp and ads, use one source of truth. The channel strategy guide helps prevent different promises across channels.
Frequently asked questions
How do I calculate a free-shipping threshold?
Start with a common order value, average shipping cost and contribution margin on the extra basket. Test a threshold where incremental contribution covers the shipping subsidy and required profit.
How far above AOV should free shipping be?
There is no universal percentage. Use the median and common order bands, then choose a reachable gap that customers can fill with relevant products without harming contribution.
Should I use average or median order value?
Use both and inspect order bands. A few large orders can raise the average, while the median and mode better show what a typical customer may be able to add.
Is free shipping really free for the business?
No. The business funds delivery through product contribution, prices, a threshold or another commercial decision. The calculator should show the subsidy explicitly.
Can a free-shipping threshold reduce profit?
Yes. It can subsidise orders that were already large enough, encourage low-margin additions or move parcels into a more expensive weight band. Measure contribution per visitor and order.
How often should a shipping threshold be reviewed?
Review after material carrier, fuel, packaging, product-price, margin or order-mix changes, and at least on a regular operating cadence. Keep a dated input sheet.
A bundle should make a customer decision easier while preserving contribution. This guide calculates the floor, chooses the discount and tests the bundle as one operating product.
Updated 24 August 2026 · Practical guide for Indian product businesses
Choose the customer problem before the price
Shopify defines bundling as selling a curated collection, often to increase basket size and simplify a decision. Start with a customer job: a complete starter set, a replenishment pack, a compatible system or a gift-ready group. A bundle created only to move an unwanted product usually feels forced.
Use the product pricing strategy to confirm each component’s normal price and cost. The bundle needs its own proposition, but it cannot escape the economics of its parts.
Bundle idea
Customer value
Warning sign
Starter kit
Complete first-use setup
Includes items not needed at start
Complementary set
Products work better together
Compatibility is assumed, not verified
Quantity pack
Convenience and lower repeat effort
Shelf life or usage does not support quantity
Gift set
Curation and presentation
Packaging cost is omitted
Build-your-own
Choice within a controlled set
Every combination has different unmodelled margin
Calculate the bundle cost as one fulfilment unit
Add landed cost for every component, bundle packaging, pick and pack effort, payment cost, channel fees, expected returns and delivery. Combined shipping may save money, or the larger parcel may move into a more expensive weight band. Test the actual packed dimensions.
Cost line
Calculation
Control
Component cost
Sum of landed unit costs
Current bills and inbound allocation
Bundle assembly
Labour and packaging
Timed packing test
Delivery
Actual or weighted parcel rate
Packed weight and dimensions
Channel and payment
Percentage plus fixed fees
Channel-specific model
Expected return cost
Probability × financial impact
Bundle and component return rule
Put the result into the contribution calculator. Do not use the standalone products’ average margin percentage as a shortcut.
Set a price floor from required contribution
The bundle price floor is the amount needed to cover variable costs and the required contribution. If variable cost is ₹900 and the business requires ₹300 contribution per bundle, the floor is ₹1,200 before considering any tax-basis adjustment. Compare this with the standalone subtotal and the customer value.
Bundle price floor = total variable bundle cost + required contribution. If the planned discount pushes price below the floor, reduce the discount, change the components or reject the bundle.
Line
Example only
Notes
Standalone subtotal
₹1,600
Normal current selling prices
Bundle variable cost
₹900
All components and fulfilment
Required contribution
₹300
Business decision
Bundle floor
₹1,200
Cost plus contribution
Proposed bundle price
₹1,440
10% below subtotal, above floor
Choose the discount after value and floor are clear
A bundle does not always need a dramatic discount. Curation, compatibility, one-click purchase and gift presentation can create value. Show the standalone subtotal truthfully and avoid inflating component prices to manufacture savings.
Pricing approach
Customer signal
Margin implication
No discount
Convenience and curation lead
Strongest price protection
Small fixed saving
Clear, easy-to-read value
Predictable cost per bundle
Percentage saving
Familiar comparison
Cost grows with subtotal
Added service or packaging
Value beyond price
Operational capacity must be costed
Tiered bundle
Choice by need and budget
Each tier needs its own floor
Use the discount strategy to cap the offer and document exclusions. A bundle should not quietly stack with every sitewide coupon.
Protect margin when components have different economics
A high-margin accessory can fund some discount on a low-margin anchor, but the calculation should remain visible. Track component-level cost and the bundle’s total contribution. Do not assume every bundle sale is incremental; some buyers would have bought the anchor and accessory separately.
Component role
Pricing consideration
Inventory consideration
Anchor product
Sets customer intent and price expectation
Do not starve standalone demand
Complement
Adds usefulness and contribution
Verify compatibility
Trial item
Introduces another product
Avoid disguising dead stock
Packaging or service
Adds perceived value
Capacity and quality control
Optional add-on
Preserves customer choice
Keep price calculation transparent
Treat the bundle as a product and its parts as inventory
A fixed bundle may have a sellable SKU, but availability depends on every required component. Define whether the system reserves parts, calculates bundle quantity from the lowest component stock or assembles in advance. Keep the same component from being promised to a standalone buyer and a bundle buyer.
Map each bundle SKU to component SKUs and quantities.
Define the out-of-stock rule for one missing component.
Prohibit substitutions unless they are disclosed and approved.
Decide whether returns accept the full bundle or individual components.
Reconcile component depletion after every channel settlement.
Shopify’s product-bundle help notes that bundle availability and channels depend on the configured bundle solution. Verify platform behaviour before launch rather than assuming inventory is automatic.
Write return and exchange rules for bundle cases
Customers may want to return one component, exchange a variant or report a defect in only part of the set. State whether partial returns are allowed, how the retained items are repriced and how discounts are allocated. The outcome must comply with applicable rights and the published policy.
Case
Decision needed
Financial control
Full unopened return
Eligibility and shipping
Reverse full bundle and revenue
One defective component
Replacement or partial remedy
Track component and service cost
Variant exchange
Stock and price difference
Recalculate only under published rule
Partial preference return
Whether permitted
Avoid leaving an unintended discount on retained items
Returns can change realised contribution sharply. Include them in the unit economics model rather than reporting only gross bundle sales.
Pilot the bundle with one audience and one job
Launch one bundle against the current purchase path. Measure bundle take rate, total conversion, average order value, contribution per visitor or conversation, component returns and fulfilment time. If the bundle mostly replaces higher-contribution separate purchases, it may look popular while reducing profit.
Validate customer need through order pairs, enquiries or observed use.
Confirm compatibility and create the component map.
Calculate cost, floor, standalone subtotal and proposed price.
Pack and fulfil test orders before public launch.
Run a controlled comparison with the normal purchase route.
Review contribution, returns, support and inventory accuracy.
Keep bundle meaning consistent across channels
Marketplace, website and WhatsApp listings may support bundles differently. Use one source for component definitions, price validity and stock. If a WhatsApp salesperson assembles a custom set, record the components and economics rather than entering one vague line item.
Give each approved bundle a version number and effective date. When a component changes, recheck fit, imagery, copy, packed dimensions and the calculated price floor before activating the new version. Retire the old version from every sales surface rather than letting two definitions share one bundle name.
The channel strategy guide helps assign price and fulfilment ownership. Review bundle definitions after supplier, packaging, fee or delivery changes. A bundle is a maintained product, not a one-time promotion graphic.
Frequently asked questions
What is product bundle pricing?
Product bundle pricing offers two or more products together at one combined price. The bundle may provide a discount, convenience or curated value compared with buying each item separately.
How do I calculate a bundle price?
Add the products’ variable costs and fulfilment effects, set the minimum required contribution, then choose a customer-facing price above that floor. Compare it with the standalone subtotal and perceived value.
How much discount should a product bundle have?
There is no universal percentage. Set the maximum discount from the bundle’s contribution floor and test whether convenience can carry a smaller discount.
Which products should be bundled together?
Bundle products that are compatible, commonly used together, bought for the same job or helpful as a starter set. Avoid forcing an unwanted item into the purchase.
Can bundles reduce profit?
Yes. A discount, heavier parcel, higher pick cost, extra returns or allocation mistakes can make a higher-value bundle less profitable than separate sales.
How should bundle inventory be tracked?
Track each component and the sellable bundle. Reserve or calculate availability from component stock, define substitution rules and prevent overselling when the same component sells separately.
A higher average order value is useful only when the extra items add contribution and customer value. This guide starts with the order distribution, then tests practical AOV levers.
Updated 24 August 2026 · Practical guide for Indian product businesses
Measure the order distribution before choosing a tactic
Average order value equals order revenue divided by order count. Shopify notes that relying on the mean alone can hide the median and most common basket. Start with a histogram or order bands, then split by channel, new versus repeat customer, discount status and product family.
Define revenue consistently. Decide how returns, taxes, shipping income and cancelled orders are handled. Connect the analysis to the unit economics guide so an AOV change can be evaluated against contribution.
View
Question answered
Risk if omitted
Mean AOV
What is average revenue per order?
Large orders can distort it
Median order value
What does the middle order look like?
Distribution stays hidden
Mode or common band
What basket occurs most often?
Tactics target an unusual customer
Contribution per order
How much value remains after variable cost?
Revenue rises while profit falls
Increase basket value by completing the customer job
The safest AOV strategy makes the purchase more complete: the right refill quantity, a compatible accessory, a care item or a ready-to-use set. Start with products bought together and support questions, not a random list of high-margin stock.
Customer need
AOV lever
Quality check
Complete a task
Complementary bundle
Every item is genuinely compatible
Avoid running out
Quantity pack
Usage and shelf life make sense
Choose confidently
Good-better-best set
Differences are clearly explained
Reduce delivery friction
Threshold or combined shipment
Margin funds the benefit
When recommendations need conversation, use the WhatsApp selling workflow to ask need-based questions before suggesting an add-on.
Build bundles around compatibility and margin
Shopify describes product bundling as grouping items into a curated offer, often to increase basket size. Calculate the combined standalone price, combined variable cost, bundle discount and fulfilment effect. A bundle can carry a smaller discount than customers expect when convenience and curation create real value.
Bundle type
Use
Margin control
Complementary set
Products used together
Protect the anchor product margin
Quantity pack
Repeat-use item
Account for weight and storage expectations
Starter kit
New customer needs a complete setup
Remove unnecessary components
Build-your-own
Customer preferences vary
Set eligible products and minimum contribution
Use the discount strategy guide to set a maximum discount from contribution, not a competitor’s headline percentage.
Design thresholds just above a reachable basket
A free-shipping or free-gift threshold should be near a meaningful order band so a relevant addition can bridge the gap. If the threshold is far above the normal basket, it becomes decoration. If it sits below current AOV, the business funds a benefit without changing behaviour.
Threshold input
Reason
Check
Median or common order value
Shows the reachable baseline
Use recent non-promotion orders
Increment needed
Defines the add-on gap
Relevant products exist near that value
Gross contribution on extra items
Funds shipping or gift
Include fulfilment weight
Qualification rate
Shows programme reach
Watch for orders already above threshold
Article 99 in this series provides the detailed free-shipping calculation. Until it is live, use the contribution calculator to test the additional basket.
Use upsells and cross-sells without creating friction
An upsell changes the chosen product to a higher-value option; a cross-sell adds a complementary item. Show the recommendation where the customer can evaluate it, explain the difference and keep the original choice visible. Avoid interrupting checkout with several unrelated pop-ups.
Product page: explain a higher-capacity or premium option with a clear comparison.
Cart: suggest one or two verified complementary items.
WhatsApp: confirm the need before proposing an addition.
Post-purchase: offer only additions that can be fulfilled cleanly and cancelled easily.
Store counter: train staff to recommend from use, not a compulsory script.
Track acceptance and removal. An add-on that is frequently removed or returned is not creating durable value.
Adapt the strategy to ecommerce and WhatsApp
Ecommerce can use behavioural placement and automated compatibility rules. WhatsApp can ask clarifying questions, but it relies on staff discipline and accurate product information. Keep prices, stock, bundle rules and order totals consistent across the two channels.
Decision
Ecommerce control
WhatsApp control
Recommendation
Product relationship rule
Need-based question and approved list
Price
Automatic calculation
Current catalogue or quoting source
Stock
Inventory validation
Verify before commitment
Customer choice
Easy remove or decline
No-pressure confirmation
Measurement
Experiment and order data
Conversation tag and final basket
The channel strategy guide helps decide which experience should own the transaction when a conversation starts on WhatsApp and finishes on a website.
Calculate incremental contribution per exposed order
Compare the treatment with a baseline. Extra revenue is not the answer if the added product has low margin, raises shipping cost or increases return risk. Calculate the contribution of the whole order and the incremental contribution created by the tactic.
Incremental contribution per exposed order = treatment contribution per exposed order − baseline contribution per exposed order. Using exposed orders prevents a high acceptance rate among a tiny self-selected group from overstating impact.
Outcome
AOV
Contribution per order
Decision
Baseline
₹1,000
₹320
Reference
Higher basket, deep discount
₹1,250
₹300
Revenue up, economics worse
Relevant add-on
₹1,180
₹365
Promising if returns remain stable
Heavy bundle
₹1,400
₹340
Check shipping and service cost
The figures are examples only. Use actual product and channel costs.
Run one AOV experiment at a time
Choose one audience, placement and offer. Define the primary metric as contribution per visitor, conversation or eligible order, with guardrails for conversion, return rate and support load. A higher AOV with a lower conversion rate may still be good or bad depending on total contribution.
Choose the common basket and customer need to improve.
Design one bundle, add-on or threshold with verified compatibility.
Calculate expected contribution and fulfilment effect.
Run against a stable baseline for a complete buying cycle.
Review conversion, AOV, contribution, returns and customer feedback.
Keep, revise or stop based on the combined result.
Keep AOV tactics accurate as products change
Assign an owner for bundle contents, compatibility, prices, stock and shipping impact. Review rules when a supplier, pack size or fulfilment rate changes. Remove recommendations that no longer fit instead of leaving them because the app still displays them.
Maintain a recommendation register with the source product, suggested product, compatibility reason, approving owner and last review date. Sample real baskets and support conversations every month. If an add-on regularly creates questions, substitutions or partial returns, suspend it until the relationship is verified again.
AOV is a supporting metric, not the business goal. Prefer an order that solves the customer’s need and produces healthy contribution over a larger basket built through pressure or confusion.
Frequently asked questions
What is average order value in ecommerce?
Average order value is total order revenue divided by the number of orders in the same period. Define whether the revenue includes tax, shipping, refunds and discounts before comparing periods.
How can an ecommerce store increase average order value?
Test relevant bundles, complementary add-ons, quantity packs, free-shipping thresholds, product education and post-purchase offers. Judge each by incremental contribution, not revenue alone.
What is a good average order value?
There is no universal target. A useful AOV depends on product prices, margin, purchase frequency, channel and order distribution. Compare your own cohorts and profitability.
Can increasing AOV reduce profit?
Yes. Deep discounts, expensive gifts, high fulfilment weight or low-margin add-ons can raise basket value while reducing contribution. Calculate the full order economics.
How do I increase AOV on WhatsApp?
Use a structured enquiry flow that identifies the customer’s need, recommends verified complementary items, confirms the full basket and makes declining an add-on easy. Avoid pressure.
Should I use mean or median order value?
Use both, plus the most common order bands. A few large orders can lift the mean and hide the basket size most customers actually choose.
Break-even ROAS is the revenue return at which advertising contributes no profit after the costs included in the model. This guide builds the number from order economics, not guesswork.
Updated 24 August 2026 · Practical guide for Indian product businesses
Understand what break-even ROAS does and does not mean
Google defines ROAS as total conversion value divided by total ad spend. Break-even ROAS adds business economics: it asks how much attributed sales value is required for the pre-ad contribution from those sales to pay for the advertising. It is a planning boundary, not proof that advertising caused every reported order.
Build the order-level inputs first with the product-business unit economics guide. Keep the calculator focused on costs that change with the order. Fixed salaries and rent can be handled in the operating target or a separate profit model, but the choice must be documented.
Metric
Formula
Meaning
ROAS
Attributed conversion value ÷ ad spend
Revenue efficiency reported against spend
Pre-ad contribution margin
Contribution before ads ÷ net revenue
Share of revenue available to fund ads
Break-even ROAS
1 ÷ pre-ad contribution margin
ROAS at zero contribution after ad spend
Operating ROAS target
Break-even plus safety and profit requirement
Decision threshold for real campaigns
Build net revenue and variable cost correctly
Begin with net product revenue on the same basis used for conversion value. Then subtract product cost, packaging, outbound fulfilment, payment cost, channel commissions, expected return and replacement cost, and any sales-linked discount. Do not subtract ad spend yet because the result is contribution before advertising.
Input
Include
Common error
Net revenue
Realised selling price after discounts and relevant taxes
Using MRP or tax-inclusive value without reconciliation
Product cost
Landed unit cost
Using supplier price but omitting inbound cost
Fulfilment
Packaging, pick, ship and sales-linked handling
Using only headline courier rate
Payment and channel cost
Gateway, COD or commission linked to sale
Treating all channels as identical
Expected returns
Probability-weighted reverse and value loss
Ignoring returns until month-end
The contribution margin calculator should be the source of these inputs. Reconcile monthly with actual settlements rather than letting an old spreadsheet become policy.
Calculate break-even ROAS from contribution margin
Suppose an order produces ₹1,000 of net revenue and ₹400 of contribution before ads. The pre-ad contribution margin is 40 percent. Break-even ROAS is 1 ÷ 0.40, which equals 2.5x. At ₹100 of ad spend, 2.5x ROAS reports ₹250 of revenue and approximately ₹100 of pre-ad contribution, so ad spend consumes the contribution.
Break-even ROAS = 1 ÷ pre-ad contribution margin. When margin is shown as a percentage, convert it to a decimal first. This relationship is valid only when the margin rate reasonably represents the product mix attributed to the campaign.
Pre-ad contribution margin
Break-even ROAS
Revenue needed for ₹10,000 ad spend
20%
5.00x
₹50,000
30%
3.33x
About ₹33,333
40%
2.50x
₹25,000
50%
2.00x
₹20,000
Use a calculator sequence that exposes assumptions
Choose a revenue basis and period that matches ad reporting.
Enter average net revenue per attributed order.
Enter each variable cost separately, including expected returns.
Calculate contribution before ads and divide by net revenue.
Divide one by the contribution margin decimal.
Add an explicit uncertainty and profit buffer for the operating target.
Calculator line
Example only
Result
Net revenue per order
₹1,500
Starting value
Variable costs before ads
₹990
Product, fulfilment, payment and expected returns
Contribution before ads
₹510
₹1,500 − ₹990
Contribution margin
34%
₹510 ÷ ₹1,500
Break-even ROAS
2.94x
1 ÷ 0.34
The example is instructional, not a benchmark. Replace every input with the campaign’s product and channel mix.
Use product-level or weighted margins for mixed campaigns
A campaign selling products with different margins should not use a simple average of margin percentages. Weight each product by its share of net attributed revenue or calculate total contribution divided by total net revenue for the mix. A shift toward a low-margin bestseller can raise the real break-even ROAS even when platform ROAS is stable.
Product group
Revenue share
Contribution margin
Weighted contribution
A
50%
45%
22.5 percentage points
B
30%
30%
9 percentage points
C
20%
20%
4 percentage points
Total mix
100%
35.5%
Break-even about 2.82x
Recalculate after major price, discount or shipping changes. The margin-safe discount guide explains why a promotion can change break-even even if unit volume increases.
Adjust for returns, cancellations and cash outcomes
Ad platforms may report conversion value before returns or cancellations are fully known. Build an expected adjustment using product and channel history, then reconcile the realised cohort later. Keep return probability, lost value, reverse shipping and non-refundable payment cost separate so the model can be audited.
Scenario
Model treatment
Review
Prepaid cancellation
Remove revenue and include non-recoverable costs
Order and payment record
COD refusal
No realised revenue plus shipping and handling loss
Carrier settlement
Return to stock
Remove sale, include reverse cost and any value loss
Inspection grade
Partial refund
Reduce realised revenue and keep applicable costs
Refund transaction
A campaign near break-even is especially sensitive to these outcomes. Use realised contribution, not only platform revenue, for the final decision.
Set an operating target above break-even
Break-even leaves no room for model error, overhead or profit. Create a target contribution after ads and solve for the required ROAS, or apply a documented buffer. The buffer should be larger when attribution is uncertain, returns are volatile, cash is tight or creative fatigue is likely.
If you require 10 percent of revenue as contribution after ads and pre-ad contribution is 40 percent, only 30 percent is available for advertising. The corresponding ROAS target is 1 ÷ 0.30, or 3.33x. This is more transparent than adding an arbitrary 20 percent to break-even.
Objective
Available share for ads
Target logic
Zero post-ad contribution
Full pre-ad contribution margin
Break-even only
Positive order contribution
Pre-ad margin minus desired contribution rate
Sustainable operating target
New-customer investment
May allow lower first-order result
Requires credible repeat-value model
Cash protection
Lower allowable ad share
Higher target and spend controls
Reconcile platform ROAS with business ROAS
Google Ads explains that conversion values can represent sales revenue or profit-related values. Whatever value is used, document it. Compare platform conversion value with paid orders, realised net revenue and contribution for the same cohort. Differences can come from attribution windows, duplicate tags, cancellations, cross-device journeys and channel overlap.
View
Numerator
Use
Platform ROAS
Reported conversion value
Optimisation signal
Realised revenue ROAS
Settled net revenue
Commercial reconciliation
Contribution after ads
Realised contribution minus ad spend
Profitability decision
Incremental ROAS
Estimated additional value caused by ads
Causal evaluation when testable
Before scaling, complete the readiness checks in the Meta ads guide and apply the same measurement discipline to any channel.
Use break-even ROAS as a boundary, not an automatic switch
A campaign below target may need a price, offer, landing-page, product-mix or measurement fix. A campaign above target may still be capacity-constrained or overly dependent on one product. Review contribution, order quality, cash timing and customer fit before changing spend.
Recalculate the model after fee, tax, fulfilment or return changes. Keep dated assumptions next to each decision so a future team member can understand why 3.2x was acceptable in one month and not another.
Frequently asked questions
What is break-even ROAS?
Break-even ROAS is the revenue-to-ad-spend ratio at which the contribution generated by attributed sales equals ad spend after the costs included in the model. Profit is zero at that boundary.
How do I calculate break-even ROAS?
If contribution margin before advertising is expressed as a decimal, break-even ROAS equals 1 divided by that margin. A 40 percent contribution margin gives a 2.5x break-even ROAS before safety allowances.
Is a higher break-even ROAS better?
No. A higher break-even ROAS means the business needs more attributed revenue for each rupee of ad spend to avoid loss, usually because pre-ad contribution margin is lower.
Should GST be included in a ROAS calculator?
Use the revenue basis that matches the advertising platform and your management accounts. Do not treat collected tax as spendable revenue. Have an accountant confirm the treatment for your business.
Why can an ad campaign beat break-even ROAS and still lose money?
The model may omit returns, fulfilment, discounts, marketplace charges, payment fees, agency costs or unattributed orders. Measurement and cash timing can also differ from the simplified calculator.
What ROAS target should a product business use?
Use a target above break-even to create room for uncertainty, overhead and profit. Set the buffer from data quality, return variability, cash constraints and the business objective.
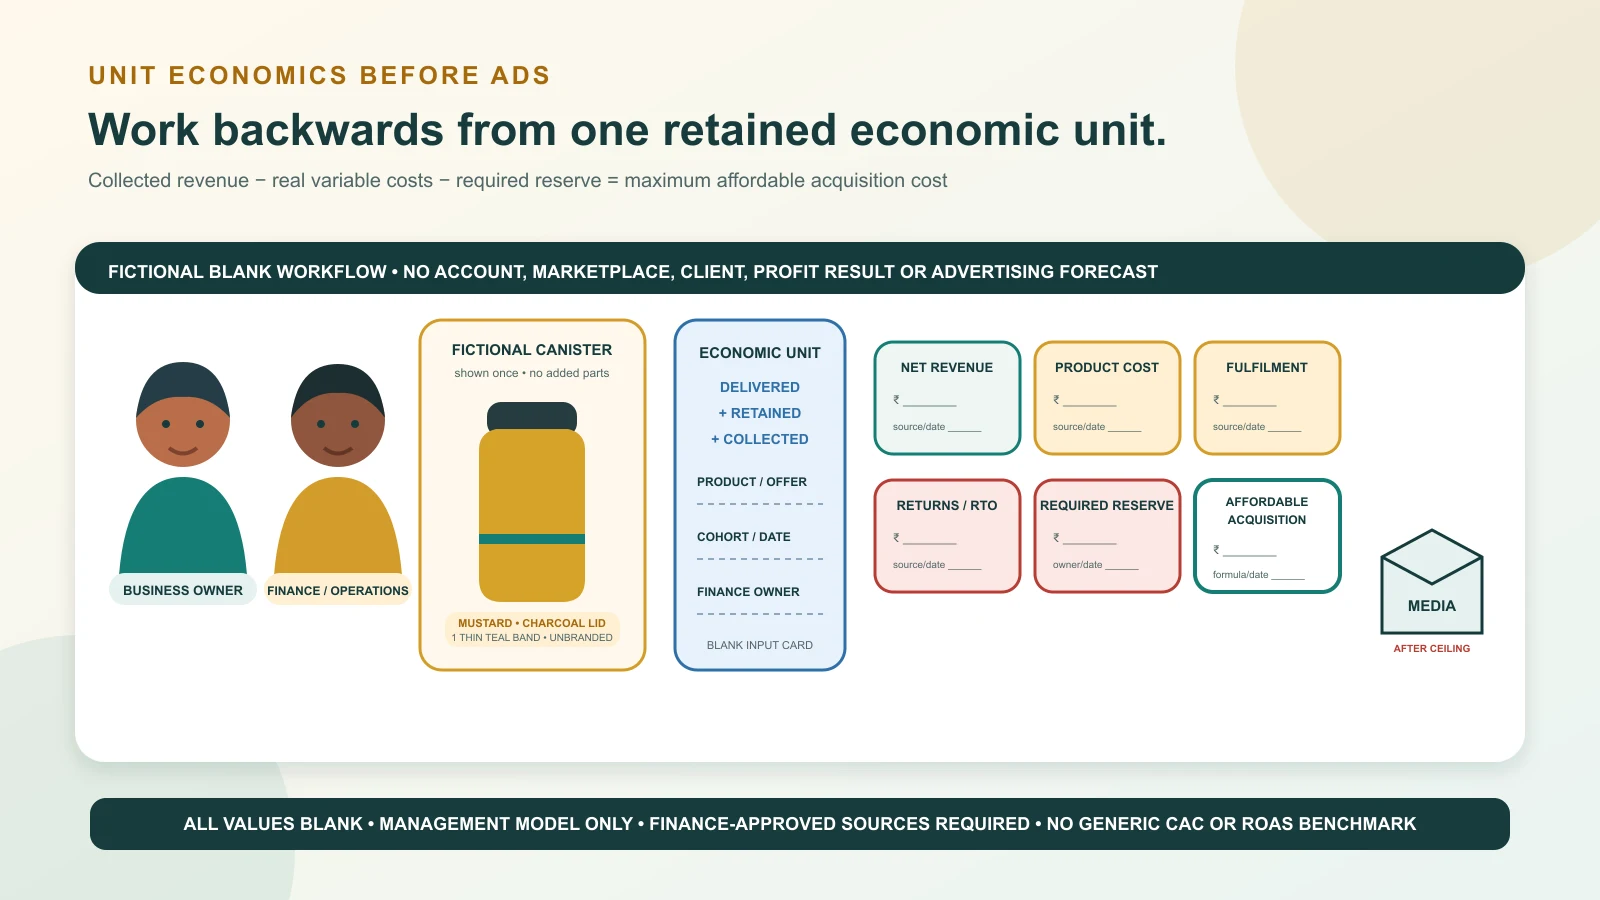
Work backwards from a delivered, retained order: only the contribution left after real variable costs can fund acquisition and the business reserve. Original GPTWala illustration using fictional people, one fictional unbranded product and blank calculation cards; it is not a client account, profit result, marketplace statement or advertising forecast.
Reviewed and updated: 12 August 2026
Before spending on digital ads, calculate how much contribution one delivered, retained and collected order creates before acquisition cost. Start with finance-approved net revenue—not MRP, gross order value or a payment screenshot—then subtract the product cost and every cost that changes with the order: packaging, shipping subsidy, payment/marketplace charges, variable fulfilment labour, expected cancellations/returns/RTO, warranty/service allowance and other order-variable costs. From what remains, protect the contribution the business requires for overhead, risk, cash and profit. Only the remainder is the maximum affordable acquisition cost.
That ceiling is business-specific and dated. There is no universal “good margin”, lead cost, customer acquisition cost or ROAS for manufacturers, wholesalers, retailers, shopkeepers, apparel sellers, jewellery businesses or product brands. A ₹100/day campaign can be a useful controlled test only after the business knows what an acquired order can afford. Budget is an input; revenue is not profit; and an attributed order is not final economics until delivery, collection, returns and costs are reconciled.
Unit economics should help an owner answer decisions such as:
Can this exact product/offer afford paid acquisition?
What must be true for a ₹100/day test to be financially interpretable?
Which product, pack, buyer or channel deserves the first test?
Is a low cost per chat producing profitable delivered orders or cheap noise?
Can the business offer a discount or free shipping without destroying contribution?
Does a wholesale order remain attractive after sampling, credit, freight and sales effort?
Are repeat purchases real enough to support a higher acquisition ceiling?
Should the business keep, fix, stop or cautiously expand a campaign?
Unit economics is a decision model, not statutory accounts
The worksheet in this guide is a management view. Finance/accounting should approve revenue, tax, inventory-cost, expense, return, credit-note and cost-allocation treatment for the actual entity. Terms such as gross margin and contribution margin are used inconsistently across businesses, so write the formula beside every label.
Do not force the advertising worksheet to match a generic internet definition when the business’s accountant and records use a documented treatment. Reconcile the management model to the accounting/order records.
Start from the final commercial event
For many product businesses, the useful base unit is:
one new-customer order that was delivered, retained beyond the defined return/cancellation window and collected
This is stronger than:
click;
conversation start;
“Hi” message;
catalogue share;
quote sent;
order placed but unpaid;
COD order shipped but returned;
payment screenshot;
invoiced B2B order still disputed; or
gross marketplace order value before returns/fees.
Some businesses need a different unit. The key is to define it before examining campaign results.
Choose the right unit and cohort
Common economic units
Business model
Useful primary unit
Why
Watch-out
D2C/retail ecommerce
delivered, retained order
Captures delivery, returns and collection
Multi-item basket mix can vary
Local retail/WhatsApp
delivered/picked-up paid order
Matches the real transaction
Store walk-ins may be wrongly attributed to ads
Apparel
delivered order after size/return window
Captures exchanges and returns
Exchange and returned inventory condition matter
Jewellery
collected order for exact item/quote
Supports price, making and payment treatment
Metal/stone price and returns can change economics
Wholesale
delivered/accepted invoice or order
Reflects pack, MOQ and freight
Credit, sales effort and bad-debt risk may dominate
Manufacturer
accepted production order/job
Includes setup and job-specific costs
One job can span batches, milestones and revisions
Dealer acquisition
activated dealer first qualified order
Separates contact from commercial activation
First order may not represent mature dealer value
Export
collected shipment/order
Captures logistics and payment terms
Currency, documentation, claims and delays need review
Define new versus existing customer
Acquisition cost should not be diluted by orders the campaign did not acquire. Separate:
verified new customers;
existing/repeat customers;
unknown identity;
dealer branches treated as one or many accounts under a written rule;
organic/direct/referral orders; and
assisted orders influenced by several touchpoints.
If a repeat customer clicks an ad and orders, decide in advance whether the campaign is measured as acquisition, retention or mixed influence. Do not change the rule after seeing the result.
Define the cohort
A cohort needs:
product/SKU or approved product group;
offer/version;
buyer type;
channel/campaign/source;
geography;
order date range;
delivery/collection cutoff;
return/cancellation/RTO observation window; and
attribution rule.
Do not mix a festival discount, full-price period, wholesale dealer campaign and existing-customer broadcast into one average.
Use mature enough outcomes
An early campaign view can show spend, clicks and conversations. It cannot show final contribution when deliveries, returns, credit notes or collections are incomplete. Mark the cohort provisional until its economic window closes.
Build a source-of-truth cost ledger
Every input needs a source, owner and date.
Input
Preferred source
Owner
Common error
Net collected revenue
Accounting/order/payment reconciliation
Finance
Using MRP or gross order value
Tax treatment
Finance-approved tax records and current official guidance
Accountant/finance
Counting tax collected as spendable revenue
Product/landed cost
Purchase, BOM, production and inventory records
Finance/operations
Using an old purchase price
Packaging
Current packaging issue/purchase record
Operations
Omitting outer pack, labels or inserts
Shipping/freight
Courier/logistics invoices and customer recovery
Operations/finance
Counting only charged freight, not subsidy/RTO
Payment/platform charges
Actual merchant/marketplace statements
Finance
Applying headline rates to all orders
Variable labour
Defined time/activity cost policy
Operations/finance
Ignoring picking, packing, customisation or support
Discount/credit/refund
Order/credit-note record
Finance
Using list price after discount
Return/RTO/cancellation
Mature order cohort and logistics records
Operations/finance
Using order-placed rate as delivered rate
Warranty/service
Claims/service cohort
Service/finance
Assuming zero because claims occur later
Creative/technology
Vendor invoices and internal allocation policy
Marketing/finance
Counting media only as acquisition cost
Media spend
Authorised ad-account billing/reconciliation
Ads owner/finance
Using dashboard spend without invoice/payment check
Use an input register
For every number, store:
metric name and exact formula;
currency and whether tax is included/excluded;
product/channel/cohort scope;
source file/system;
extraction date;
owner/reviewer;
observation window;
provisional/final status; and
limitation or estimation method.
Tax is not a plug number
Whether an amount is revenue, tax, creditable input tax, expense or inventory cost depends on the entity and transaction. Use finance-approved net revenue/costs and current official sources such as the GST portal where applicable. This article does not give tax advice or prescribe a GST treatment.
Estimates need labels
If a new product has no return or warranty history, do not enter zero. Use a clearly labelled planning allowance approved by finance, show the assumption, and replace it with mature cohort evidence. Run a sensitivity range instead of hiding uncertainty behind one decimal.
Calculate contribution before acquisition
Use one documented formula. A practical management version is:
Contribution before acquisition = finance-approved net revenue − product/landed cost − order-variable fulfilment costs − expected post-order variable costs
Break it into rows.
Step 1: finance-approved net revenue
Start with the amount the business recognises for the delivered/retained order after relevant discounts, refunds and credit notes, under its accounting policy. Do not use:
crossed-out MRP;
cart total before discount;
amount including a tax that finance excludes from revenue;
cancelled order value;
COD amount not collected;
refunded amount; or
a marketplace’s customer-facing total without statement reconciliation.
Step 2: product or landed cost
Depending on the model, include the finance-approved cost of:
purchased inventory;
raw material/components;
direct production labour where treated as variable;
inward freight/duty/handling allocated to the unit;
job work;
quality loss/scrap under the approved method; and
product-specific packaging that belongs in landed cost.
Avoid counting the same packaging or freight twice.
Step 3: order-variable fulfilment costs
Include costs that arise because this order exists:
outer packaging and consumables;
pick/pack or customisation labour under the chosen policy;
outward shipping/freight less any amount recovered from the buyer;
COD/collection, payment-gateway or marketplace charges;
platform commission or order fee;
installation/service visit where order-variable;
sample, documentation or handling cost tied to the order; and
sales incentive/commission tied to the transaction.
Step 4: expected post-order variable costs
Use observed cohort data where possible for:
cancellations after processing;
RTO and failed delivery;
customer returns and exchanges;
reverse logistics;
reinspection/repacking/markdown of returned inventory;
refunds and payment reversals;
warranty/service claims; and
bad debt or credit loss under the approved B2B method.
Step 5: contribution before acquisition rate
Contribution-before-acquisition rate = contribution before acquisition ÷ finance-approved net revenue
State the period and product/offer/channel. A blended percentage can hide a loss-making SKU or freight zone.
Do not call this net profit
Contribution before acquisition may still need to fund:
rent and salaried staff;
software and professional fees;
utilities and administration;
inventory financing and working-capital cost;
equipment and depreciation under finance policy;
owner compensation;
brand/content investment;
tax on profit; and
retained profit/risk reserve.
The model must reserve for those needs before calling the acquisition ceiling “affordable”.
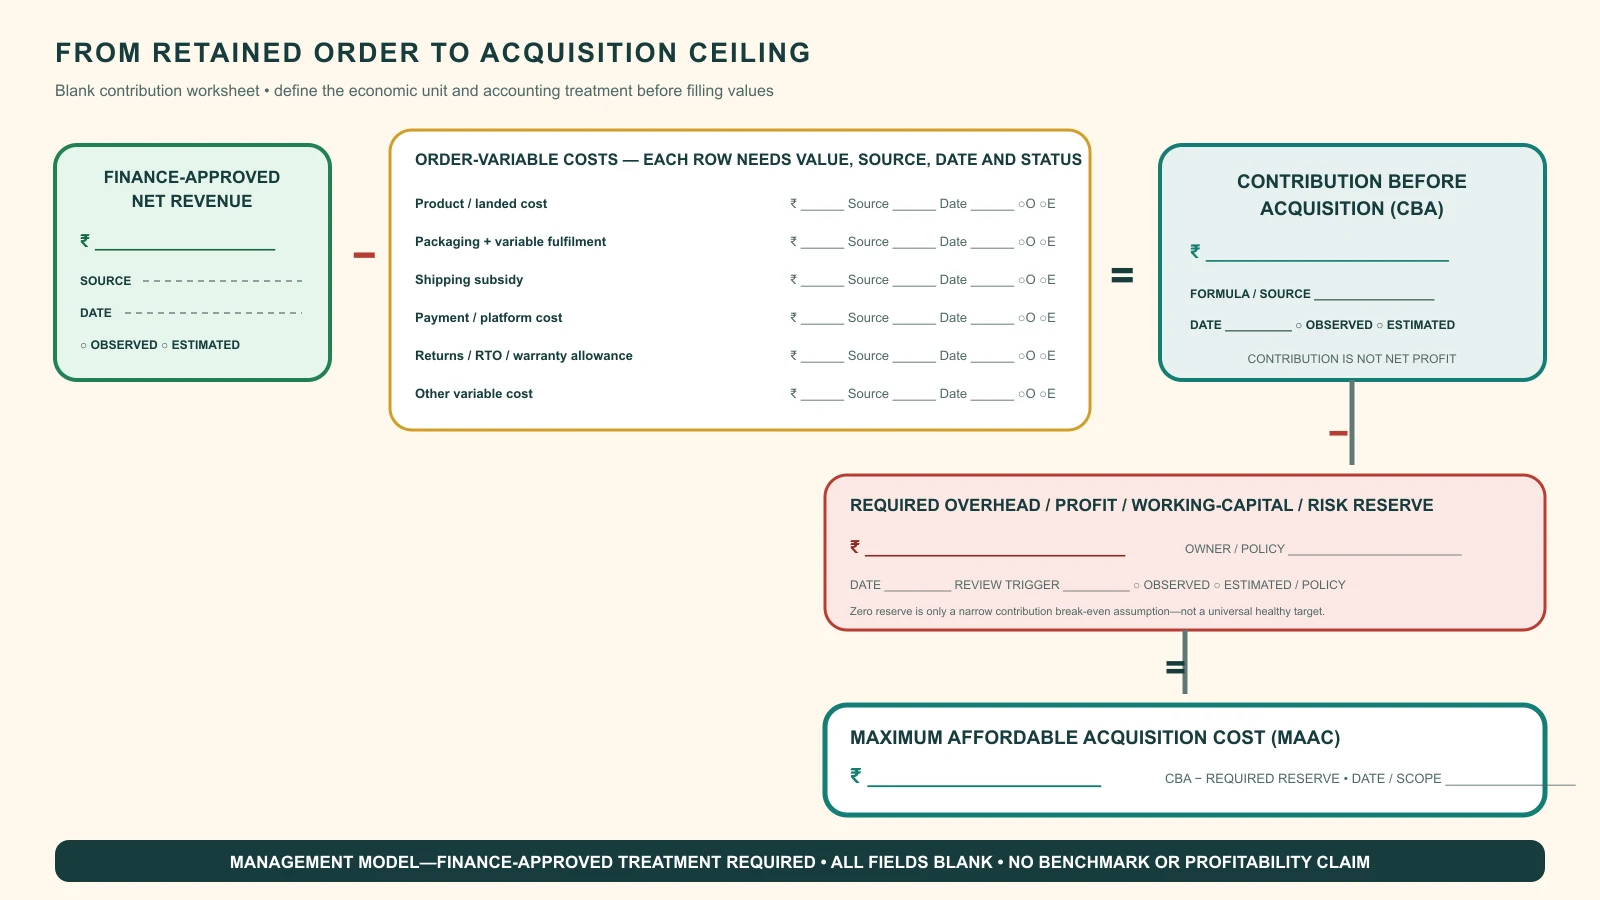
Revenue becomes decision-ready only after real variable costs, expected post-order costs and the required business reserve are visible. Every value, source, date and observed/estimated field is blank; the worksheet contains no benchmark, tax treatment, client margin or profitability claim.
Include returns, RTO, warranty and hidden variable costs
Use expected cost per placed order carefully
When analysing placed-order economics, estimate the expected downstream cost using the business’s mature cohort:
Expected return/RTO cost per placed order = total relevant reverse-logistics, lost fulfilment, processing and unrecovered product costs for the cohort ÷ placed orders in that cohort
Alternatively, analyse only delivered/retained orders and allocate the failed-order costs across those successful units. Choose one method and avoid double counting.
RTO is more than outward freight
Depending on actual contracts and product recovery, RTO may include:
forward freight;
return freight;
COD/processing charges;
packaging loss;
handling and customer-support time;
damage, expiry or markdown; and
inventory blocked while in transit.
Use courier statements and operations records, not an online “India average”.
An exchange can still cost money
Even when revenue remains, a size/colour exchange may add reverse freight, reshipping, handling, packaging, markdown and support cost. Apparel sellers should distinguish:
exchange completed;
full return/refund;
RTO before delivery;
customer-paid versus seller-paid shipping; and
item restored to full-value inventory versus marked down/damaged.
Warranty arrives later
If claims occur months after sale, a recent campaign cohort may look stronger than it is. Use a product-age cohort or finance-approved allowance. Do not claim “zero warranty cost” merely because the observation window is too short.
Creative and technology can be variable or shared
Classify:
media spend directly tied to the campaign;
creative production tied to one product/test;
messaging/platform charges tied to delivered messages or conversations;
landing-page/tool fees bought for the test;
agency or affiliate commission tied to spend/orders; and
shared salaries/software/brand assets.
Apply a documented allocation policy. Show both views when a cost is disputed: incremental cash decision and fully loaded management view.
Set a maximum affordable acquisition cost
Protect the required contribution first
Define:
CBA: contribution before acquisition per economic unit;
Required reserve: amount the business chooses to retain for overhead, working capital, profit and risk; and
MAAC: maximum affordable acquisition cost.
MAAC = CBA − required reserve
If the result is zero or negative, that unit/offer cannot fund paid acquisition under the current assumptions. Fix price, cost, pack, channel, conversion/returns or business expectations—or do not advertise it for acquisition.
Break-even and target are not the same
If the required reserve is zero, the ceiling may describe a narrow contribution break-even before overhead and other costs. That is not necessarily a healthy target. A business needs a reserve policy, not “spend until nothing remains”.
Date and scope the ceiling
Every MAAC should state:
₹ amount and currency;
per new delivered/retained order or other unit;
product/SKU/offer;
channel/geography;
cohort window;
return/warranty maturity;
included/excluded cost rows;
required reserve; and
owner/review date.
Example label:
“Maximum acquisition cost: ₹[X] per verified new-customer delivered/retained order for product family [P], offer version [V], service zones [Z], based on [DATE RANGE], with [RETURN WINDOW] and required reserve ₹[R]. Provisional until [DATE].”
Use sensitivity, not false precision
Create low/base/high cases for uncertain inputs such as:
selling price/discount;
product cost;
shipping zone mix;
RTO/return rate and recovery value;
warranty allowance;
payment/channel fees;
sales conversion; and
repeat purchase.
If a small change makes MAAC negative, the offer is fragile. Do not hide that with an average.
Translate order economics into funnel ceilings
Ads generate upstream events; economics is usually decided downstream.
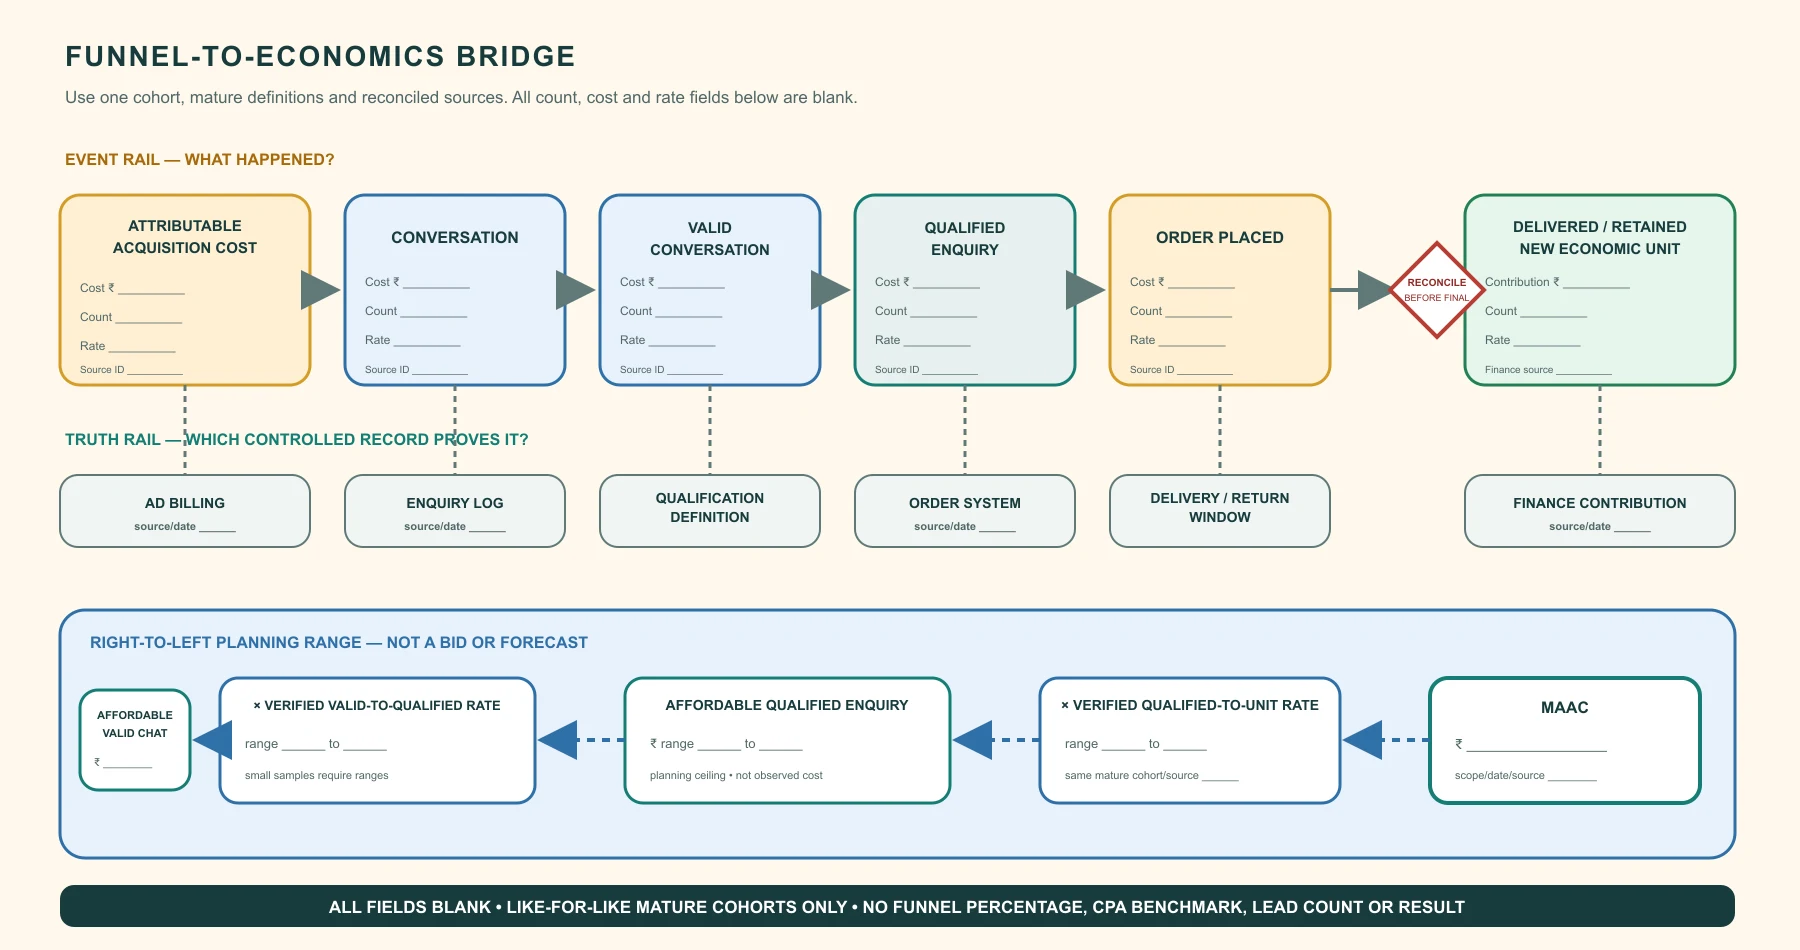
Affordable cost per valid conversation = affordable cost per qualified enquiry × verified valid-conversation-to-qualified-enquiry rate
These are planning ceilings, not platform bids or guarantees. Rates must come from like-for-like cohorts. A few early orders, a different channel or a repeat-customer-heavy sample should not drive a precise ceiling.
Use ranges when the denominator is small
If three orders came from a small campaign, do not declare the observed order rate permanent. Show scenarios across a plausible, explicitly labelled range and cap spend while evidence matures.
Keep attribution separate from affordability
MAAC asks what an acquired unit can afford. Attribution asks which activity deserves credit. A profitable order may have come through an ad, a store visit, a dealer relationship, a repeat purchase, an organic search, a referral or several of them. Keep:
platform-reported attribution;
first-party source/context;
salesperson/customer-reported source where collected appropriately; and
accounting/order outcome
as separate fields. Reconcile; do not force certainty the data does not support.
Upstream cost ceilings come from downstream verified contribution and observed stage rates—not from a generic lead-price benchmark. This blank planning bridge is not a media plan, bidding recommendation, conversion forecast or client result.
Use ROAS without confusing revenue and profit
Revenue ROAS
Revenue ROAS = attributed finance-approved revenue ÷ ad spend
It says how much attributed revenue is recorded per unit of ad spend under the chosen attribution rule. It does not subtract product cost, fulfilment, returns, fees, labour, overhead or tax treatment.
Under a narrow view where acquisition cost contains all relevant acquisition costs and the required reserve is zero, 1.0 means contribution before acquisition equals acquisition cost. That is not automatically net-profit break-even. The business may still need overhead, working capital and profit reserve.
Contribution after acquisition
Contribution after acquisition = attributed contribution before acquisition − attributable acquisition cost
This is more decision-useful than revenue ROAS when product/channel variable costs differ.
Why one “break-even ROAS” can mislead
A single threshold may fail when:
product mix has different contribution rates;
discounts/returns vary by campaign;
freight zones differ;
repeat customers are mixed with new customers;
platform revenue is not reconciled to collected/retained orders;
creative/agency/tool cost is excluded; or
the business needs a reserve above contribution break-even.
Show the formula, cost scope and cohort beside the target.
Work through a fictional example
The following numbers are purely illustrative arithmetic, not Indian market averages, recommended margins, normal return rates or a GPTWala client result.
Fictional retained order
A fictional local product brand analyses one new-customer delivered and retained storage-box order. Finance provides:
Row
Illustrative amount
Finance-approved net revenue
₹1,800
Product/landed cost
−₹880
Packaging and variable fulfilment
−₹90
Shipping subsidy
−₹130
Payment/channel charges
−₹40
Mature-cohort return/RTO allowance
−₹85
Warranty/service allowance
−₹25
Contribution before acquisition
₹550
Required overhead/profit/risk reserve
−₹330
Maximum affordable acquisition cost
₹220
This does not mean ₹220 is a good CAC for another product—or even for this fictional brand next month. If product cost, discount, freight, return experience or reserve changes, the ceiling changes.
Translate to an enquiry ceiling symbolically
If the business’s verified qualified-enquiry-to-new-delivered-order rate is q, then:
Affordable cost per qualified enquiry = ₹220 × q
Do not insert a generic q. Use a mature like-for-like cohort or a labelled scenario range.
Test a free-shipping offer
If the seller absorbs another ₹100 of shipping without raising revenue or reducing another cost:
CBA falls from ₹550 to ₹450;
with the same ₹330 reserve, MAAC falls from ₹220 to ₹120.
The offer may improve conversion, but that improvement must be observed and large enough to compensate. “Free shipping” is not free to the economics.
Test a discount
If net revenue falls by ₹150 while costs stay the same, CBA and MAAC each fall by ₹150. A discount should be evaluated against the verified change in delivered, retained orders and contribution—not clicks or checkout starts alone.
Compare products, offers and channels
Build one row per economic slice
Do not rely only on a blended business average. Compare:
SKU/product family;
single item versus bundle;
retail versus wholesale;
prepaid versus COD;
local versus distant shipping zone;
full price versus discount;
marketplace versus owned/WhatsApp route;
new versus repeat customer; and
campaign/creative/offer version.
A low-margin product can have a role—but name it
Possible roles include:
acquisition entry product;
bundle anchor;
sampling product;
dealer activation order;
repeat-purchase driver; or
store-visit trigger.
Do not assign that role after losses appear. Define the subsequent behaviour required, track it, and cap exposure until evidence exists.
Bundles need component truth
For a bundle, calculate:
exact included SKUs and quantities;
net bundle revenue;
component costs;
bundle packaging/weight/freight;
picking complexity;
return/refund treatment; and
whether one component creates service/warranty cost.
AI imagery or copy must show the exact bundle. Do not add a prop that appears included or remove a costly component from the visual.
Marketplace and direct orders are not interchangeable
A marketplace order may include commissions, logistics, payment/settlement, returns, storage, advertising and other current charges under the seller’s actual statement. A direct WhatsApp order may add staff handling, payment, courier and support costs. Use actual contracts/statements; do not copy a generic fee percentage.
Compare contribution, not just selling price
A higher-price SKU may have lower contribution after freight, returns or service. A lower-price bundle may improve shipping efficiency. Let the row-level ledger reveal the result.
Adapt the model for B2B and manufacturing
Define the B2B economic unit
Possible units:
accepted first dealer order;
collected invoice;
production batch;
project/job;
annual account cohort; or
sample-to-order programme.
Use the unit that matches the commercial decision. The B2B lead-generation guide owns dealer/business-buyer acquisition; this page determines whether that acquisition is affordable.
Add sales and pre-order costs
B2B acquisition may include:
sample/sample freight;
catalogue/specification preparation;
salesperson calls/visits and travel;
technical review or application engineering;
quotation/tender effort;
dealer onboarding/training;
credit checks and documentation; and
channel commission.
Decide which are incremental and which are shared. Do not compare media-only B2B CAC with a fully loaded offline acquisition cost.
Calculate job contribution
For a custom manufacturing job, include:
material and bought-out components;
direct/job-variable labour;
machine/setup time under the finance policy;
tooling/design/prototype treatment;
inspection, rejection, rework and scrap;
job-specific packaging/documents;
freight and installation/commissioning;
sales/agent commission;
credit/warranty allowance; and
change-order/version risk.
Do not advertise a price or lead time derived from a standard product when the job requires engineering confirmation.
Separate first-order and mature-account value
A dealer’s first order may carry onboarding/sample cost and a small pack. Later orders may differ. Do not assume future repeat value to justify acquisition unless cohort records support:
repeat rate;
time to repeat;
contribution by repeat order;
churn/inactivity definition;
service/credit cost; and
channel conflict/returns.
Article 28 owns retention strategy. A29 allows repeat contribution into the acquisition ceiling only when the evidence and risk policy support it.
Credit changes cash and risk
An order can show positive contribution while cash remains blocked. Track payment terms, days outstanding, defaults/disputes, financing cost and inventory commitment. A high “lifetime value” account that pays late and consumes technical support may be less attractive than topline suggests.
Check cash flow and working capital
Unit economics and cash flow answer different questions.
Build a cash timeline
Record when the business pays for:
raw material/inventory;
packaging;
production/job work;
content and ads;
marketplace/payment settlements;
courier/freight;
refunds/returns;
sales commission; and
tax/other statutory obligations under finance guidance.
Then record when cash is actually collected.
Watch the growth cash gap
Paid acquisition can increase orders while consuming cash through inventory, production, COD settlement, credit terms and returns. A profitable unit on paper may still create a funding gap.
Add a working-capital gate
Before expanding spend, ask:
Can inventory/production support the expected range without harming core customers?
How many days of cash are tied between acquisition spend and collection?
What happens if return/RTO or payment delays rise?
Is there an authorised spend cap independent of platform recommendations?
Who can pause ads when stock, cash or fulfilment changes?
Do not use credit-card availability or platform delivery as proof that spend is affordable.
Set the economic gate before ads
Complete the pre-spend card
Field
Required answer
Economic unit
Exact delivered/retained/collected event
Product/offer
SKU/group, price/discount and version
Cohort
Buyer, channel, geography, dates and maturity
CBA
₹ amount plus formula/cost scope
Required reserve
₹ amount and owner-approved purpose
MAAC
₹ per verified new economic unit
Funnel planning range
Like-for-like observed/scenario rates with caveat
Attribution
Platform, first-party and accounting fields kept distinct
Cash gate
Spend/stock/working-capital cap
Stop owner
Named person with account authority
Review date
When provisional outcomes can be reconciled
Do not launch on revenue ROAS alone
Before campaign setup, the ads owner should receive:
dated MAAC;
cost scope;
qualified-event definition;
new-customer rule;
return/collection maturity date;
provisional funnel ceiling/range;
authorised budget cap; and
stop triggers.
Use the Meta readiness guide for the remaining product, destination, access, payment, measurement, response and fulfilment gates.
The ₹100/day test still needs the gate
Small spend can limit financial exposure, but it does not fix a negative unit, wrong product, misleading offer, broken destination or unstaffed WhatsApp route. Meta’s official budget guidance describes budget/cost mechanics; it does not promise an outcome at ₹100/day.
Prewrite economic stop triggers
CBA or MAAC becomes zero/negative under updated facts;
product/offer price or cost changes materially;
stock/fulfilment cannot support the offer;
return/RTO/complaint evidence breaches the owner-set limit;
attribution or order reconciliation breaks;
spend exceeds authorised cap;
acquired orders are uncollected or disputed; or
working-capital/cash limit is reached.
Reconcile a campaign after delivery
Keep three views
Platform view: spend, delivery, clicks/conversations and platform attribution.
Finance view: collected revenue, credits/refunds, costs, contribution and cash timing.
Do not force one dashboard to become the sole source for all three.
Reconciliation table
Stage
Count/value
Exclusions
Source
Status
Media/attributable acquisition cost
₹
tax/creative/agency scope stated
Ad billing + finance
Provisional/final
Conversation starts
count
tests/duplicates stated
Platform/WhatsApp log
Provisional/final
Valid conversations
count
spam/wrong intent/geography
Controlled enquiry log
Final after review
Qualified enquiries
count
definition locked pre-test
Sales log
Final after review
Orders placed
count/₹
cancelled/unpaid not final
Order system
Provisional
Delivered/retained new units
count
returns/RTO/repeat separated
Order/operations
Final after window
Finance-approved net revenue
₹
credits/refunds/tax treatment
Accounting
Final
Contribution before acquisition
₹
formula/cost scope stated
Unit-economics ledger
Final/estimated
Contribution after acquisition
₹
all included acquisition cost stated
Reconciled ledger
Decision-ready
Compare actual CAC with MAAC
Actual CAC below MAAC does not automatically mean scale; inspect volume, confidence, capacity and cash.
Actual CAC above MAAC does not automatically mean ads are the only problem; diagnose product, offer, creative, destination, response, qualification, returns and attribution.
A provisional CAC should not be compared as if all orders are mature.
Keep, fix, stop or expand carefully
Keep: economics and operations are within the dated control range.
Fix: one diagnosed layer can be changed and versioned.
Stop: current unit, evidence, policy, stock, cash or capacity cannot support spend.
Expand carefully: mature evidence supports a larger bounded test; recheck the ceiling and cash gate first.
Apply the model to Indian product businesses
The following are fictional scenarios, not client results, market averages or recommended margins.
Apparel seller: include exchanges and RTO
A Surat apparel seller must calculate by collection, offer, payment method and shipping zone. The ledger includes garment landed cost, pack, forward/reverse freight, COD/payment charges, exchange reshipment, return condition/markdown and customer support. An AI model image that changes length, fit, drape, transparency or included pieces can worsen returns and also mislead the buyer; economics never excuses product drift.
Jewellery retailer: price volatility and exact-item truth
A Jaipur jewellery business uses finance-approved item/quote revenue and exact material, making, stone/component, certification/hallmark, packaging, payment, insurance/shipping and return/service treatment. It should not advertise a stable acquisition ceiling while the product price or quote basis has changed. Styled imagery cannot imply a different stone, purity, weight, setting, quantity or certification.
Local appliance retailer: delivery and installation
The order ledger includes the exact model, purchase cost, delivery subsidy, installation responsibility, payment cost, incentive and warranty/service allowance. A store-visit influenced by ads may be difficult to attribute; keep source evidence separate. “Free installation” requires real cost and scope.
Manufacturer: contribution per accepted job
A Rajkot component manufacturer chooses one job/product family, then includes material, machining/job work, setup, inspection, scrap/rework, pack, freight, sales/technical effort, credit and warranty. A quote request is not revenue; a purchase order is not collected contribution; a technical conversation is not compatibility approval.
Wholesaler: case economics and dealer activation
The wholesaler calculates case/pack contribution, freight recovery, discount, salesperson/dealer onboarding, returns/shortage claims and credit. If the first order is subsidised to activate a dealer, the expected repeat value must come from a mature dealer cohort rather than optimism.
Marketplace product brand: reconcile the statement
The brand uses the actual seller statement for commissions, fulfilment, storage, returns, refunds, ads and settlement—not a generic fee calculator. Product-level economics must match the exact listing/variant. A gross marketplace sales number is not the cash collected or contribution.
Exporter: contribution and cash by shipment
The exporter includes product/job cost, export packaging, inspection, documentation, freight/insurance under the agreed basis, agent/marketplace fees, currency/collection treatment, claims/returns and finance cost. Cross-border tax, customs, legal and accounting treatment requires authorised specialists.
Protect product, price and performance truth
Unit economics depends on the same truth the buyer sees.
Product truth
calculate the exact SKU, variant, pack or job shown;
separate included product from props/context;
do not use a cheaper product’s cost under a premium product image;
do not assume a prototype’s cost equals production; and
version bundle contents and substitutions.
Price truth
use actual net selling/quote price by cohort;
make tax, freight, MOQ, eligibility and offer terms clear;
do not manufacture a crossed-out reference price;
do not call shipping, sample or installation “free” while hiding mandatory cost; and
expire/review economics when price or offer changes.
Claim truth
The ASCI Code says objective claims should be capable of substantiation and visual presentation should not mislead by implication, omission, ambiguity or exaggeration. India’s official misleading-advertisement guidelines are another publication-day source.
Do not improve apparent conversion by overstating quality, origin, scarcity, stock, performance, savings, certification or customer results. Returns and complaints may reveal the commercial cost later; the communication is still wrong at publication.
Measurement truth
state numerator, denominator, cohort and maturity;
distinguish observed, estimated and assumed inputs;
keep platform attribution separate from accounting fact;
label media-only versus fully loaded CAC;
do not cherry-pick a successful SKU/date range; and
do not present the fictional worked example as a benchmark.
Build the worksheet
Use a workbook or controlled system with these tabs/sections.
1. Definitions
economic unit;
new-customer rule;
delivered/retained/collected rule;
product/offer/channel/geography scope;
cohort dates and maturity window;
attribution methods; and
owner/approval/version.
2. Unit cost ledger
Row
₹ per unit/order
Source
Date
Observed/estimated
Owner
Finance-approved net revenue
Product/landed cost
Packaging
Shipping subsidy
Payment/platform cost
Variable labour/commission
Return/RTO allowance
Warranty/service allowance
Other order-variable cost
Contribution before acquisition
Formula
Required reserve
Owner policy
MAAC
Formula
3. Funnel cohort
Store spend/cost scope, clicks/visits, conversations, valid conversations, qualified enquiries, orders, delivered/retained new units, revenue, CBA and contribution after acquisition. Use formulas with error/zero-denominator handling; do not display infinite or fabricated rates.
4. Scenario table
Change one or a small named set of inputs across low/base/high scenarios. Include price, cost, freight, return/RTO, conversion, reserve and repeat assumptions. Never overwrite observed actuals with the preferred scenario.
5. Reconciliation
Tie campaign/ad account, enquiry/order IDs, finance periods and cohort status. Record unmatched items and do not silently drop them.
6. Decision log
For every keep/fix/stop/expand decision, record:
date and owner;
cohort/version;
evidence and limitations;
chosen action;
budget/stock/cash cap;
changed variable; and
next maturity/review date.
Connect unit economics to the DAA framework
The DAA sequence is Digital Presence → AI Content Creation → ₹100/day WhatsApp ads. Unit economics sets the guardrail before the final paid layer: it tells the business which product/offer can be tested, what downstream event matters, what acquisition may cost and when to stop.
If your product business still depends mainly on walk-ins, dealer calls, exhibitions or forwarded catalogues, GPTWala’s DAA workshop explains how these layers connect. The workshop is educational. It does not guarantee reach, chats, enquiries, orders, sales, earnings, profit or return on ad spend.
Frequently asked questions
What is product-business unit economics?
It is a documented view of the revenue, variable costs, contribution, acquisition cost and required reserve for a defined product/order/customer unit and cohort. It helps the business decide whether an offer/channel can afford paid acquisition. It is not a replacement for statutory accounts.
What unit should I use before digital ads?
For many retailers, use a new-customer delivered, retained and collected order. Manufacturers may use an accepted job or collected invoice; wholesalers may use an accepted/delivered order; dealer programmes may use an activated dealer’s first qualified order. Define it before testing.
What costs should I subtract before ad spend?
Subtract the finance-approved product/landed cost and order-variable packaging, shipping subsidy, payment/platform charges, variable labour/commission and expected return/RTO/warranty/service costs. Add any other cost that occurs because the order exists. Document scope and avoid double counting.
Is gross margin the same as contribution margin?
Not necessarily. Businesses use these labels differently. Write the formula beside the term. This guide’s contribution-before-acquisition measure subtracts all defined order-variable costs before acquisition but may still need to fund overhead, working capital and profit reserve.
How do I calculate maximum affordable acquisition cost?
Subtract the required overhead/profit/working-capital/risk reserve from contribution before acquisition: MAAC = CBA − required reserve. Date it and state the product, offer, channel, cohort, maturity and included costs.
What is a good customer acquisition cost for an Indian product business?
There is no universal good CAC. The affordable amount depends on your exact contribution, required reserve, returns, fulfilment, repeat evidence, cash and risk. An online industry average cannot replace your ledger.
Is ₹100/day enough to test ads profitably?
It may be a bounded learning input, but it does not guarantee enough volume, a lead or profit. First establish MAAC, tracking, response capacity, stop rules and the decision the small test can realistically inform.
What is break-even ROAS?
It depends on the formula and costs. Revenue ROAS does not subtract product/fulfilment costs. Contribution ROAS compares contribution before acquisition with attributable acquisition cost. Even contribution ROAS of 1.0 may only represent a narrow pre-overhead break-even if no required reserve is included.
Should I include creative and agency costs in CAC?
State both media-only and fully loaded/incremental views when useful. Include costs tied to acquiring the cohort under a documented allocation policy. Do not compare a media-only CAC with another channel’s fully loaded cost.
How do I account for returns and COD RTO?
Use mature cohort records for forward/reverse freight, fees, packaging, handling, damage/markdown and unrecovered product cost. Choose whether to allocate failed-order costs across placed or successful orders and avoid double counting. Do not use a generic national rate.
Can I use lifetime value to justify a higher CAC?
Only with mature cohort evidence for repeat rate, time to repeat, repeat contribution, churn, returns, service, credit and retention cost. Use conservative scenarios; do not assume every first-time buyer repeats.
Why can a campaign show high ROAS but still lose money?
Platform-attributed revenue may include low-margin products, discounts, repeat customers, cancellations, returns or tax, while excluding product, freight, payment, marketplace, labour, creative, agency and overhead costs. Reconcile delivered/retained orders to finance contribution.
How often should I update the unit-economics model?
Update when price, product cost, freight, payment/platform fee, returns, warranty, offer, channel, tax/accounting treatment, cash policy or reserve changes—and before material spend expansion. Also replace provisional cohorts when outcomes mature.
What should make me stop digital ads immediately?
Stop or hold when product/offer truth breaks, MAAC becomes non-positive, stock/fulfilment fails, spend breaches authority, attribution/reconciliation fails, returns/complaints/cash exceed owner-set controls or the business cannot service valid enquiries.
Practical decisions. Verified business truth. Clear next steps.
Use this guide as an operating checklist, then verify platform rules, commercial records and customer-facing promises before implementation.
Reviewed and updated: 12 August 2026
Set a product price by defining the exact economic unit, calculating finance-approved landed and variable channel costs, adding the required contribution reserve, testing buyer value and competitive alternatives, and documenting how taxes, freight, discounts, returns and commissions affect the final payable amount. Use different channel prices only when the economics and customer promise justify them, not to hide costs.
This article owns the pricing decision system from cost floor to approved channel price; a qualified finance or tax professional must confirm statutory treatment. This guide gives you an operating method, not a promise of rankings, enquiries, sales or profit. Platform policies, fees, eligibility and laws can change, so verify the linked primary sources and your own commercial records before implementation.
The real question is not whether a product pricing strategy sounds useful. The question is whether it solves a defined buyer or operating problem for one product, audience and channel without breaking product truth, margin, consent or delivery capacity.
Use these diagnostic questions before spending money or assigning work:
What exact product, pack, customer and channel does the price cover?
Which costs change when one more unit or order is sold?
What contribution must remain for overhead, working capital, risk and profit?
Which buyer alternatives and value differences are genuinely comparable?
Write the answers in one decision note. If a critical answer is unknown, make discovery the next task. Do not let an attractive tool, template or competitor example silently become the strategy.
Build the source-of-truth sheet first
Every execution step should pull facts from an approved record. A source-of-truth sheet prevents a copywriter, agency, AI tool or busy salesperson from filling a gap with a plausible but wrong product promise.
Truth item
Authoritative source
Owner
Stop condition
Product and offer facts
Approved SKU, catalogue and offer master
Product or merchandising owner
A buying-critical field is missing or inconsistent
Buyer need and language
Recorded enquiries, interviews and sales notes
Sales or customer owner
The audience is assumed rather than evidenced
Price, margin and fulfilment
Current finance, stock and delivery records
Finance or operations owner
The promise cannot be fulfilled profitably or reliably
Channel and permission rules
Current platform policy and consent record
Channel owner
Permission, eligibility or policy is unclear
Add a version date to the sheet. When price, stock, specification, channel rule, audience permission or fulfilment promise changes, pause affected assets until their owner approves the update.
A practical implementation workflow
Step 1: Define the pricing unit
Specify SKU or configuration, pack, quantity, channel, customer type, geography, tax/freight basis and validity period.
Evidence before moving on: A buyer and finance team would interpret the price the same way.
Step 2: Build the cost floor
Use current landed/product cost plus packaging, fulfilment, payment/platform, commission, return/RTO/warranty and other order-variable costs.
Evidence before moving on: Every input has source, owner and date.
Step 3: Set the required reserve
Finance defines what contribution must remain for overhead, working capital, risk and profit before acquisition or discretionary discount.
Evidence before moving on: An owner-approved minimum contribution rule.
Step 4: Test value and alternatives
Compare use case, quality, service, availability, trust and total buyer cost against real substitutes. Do not copy a competitor price without matching scope.
Evidence before moving on: Documented comparison with like-for-like boundaries.
Step 5: Approve channel and discount rules
Set price floors, authority, expiry, bundles, freight/tax disclosure, exceptional approvals and review triggers.
Evidence before moving on: A versioned price book and deviation log.
Do not combine all steps into one launch. A small controlled version creates evidence that can be reviewed. A large rollout creates more places for the same unnoticed error to spread.
Use the decision table
Situation
Recommended action
Avoid
Cost floor exceeds accepted market range
Redesign product, pack, channel or cost structure
Selling below control without a funded reason
Different channels have different costs
Price from channel economics and transparent terms
Using one price while hiding unavoidable fees
B2B quantity changes cost
Use quantity breaks from verified economics and capacity
Arbitrary discount slabs
Competitor cuts price
Recheck comparable scope and contribution before reacting
Automatic matching
Treat this table as a starting policy. Your product risk, average order value, buying cycle, staff coverage, cash cycle and after-sales burden may require stricter gates.
Apply it to Indian product businesses
Local retailer
A product has store and online fulfilment costs. The owner separates product cost from channel-specific payment, packing, shipping and return allowances before approving prices.
Proof to keep: Retained contribution by channel and exception log.
Wholesaler
Case quantity affects picking and freight. Quantity prices use actual pack economics, credit and delivery basis, with validity and authority recorded.
Proof to keep: Order contribution by quantity band and collection status.
Manufacturer
Customisation changes setup and material use. The quote separates standard base, custom inputs, tooling/setup and delivery rather than forcing a catalogue price.
Proof to keep: Estimate-to-actual variance and approved change orders.
These examples are intentionally operational rather than aspirational. Replace every placeholder with current records from the actual business. Do not present a fictional example as a client result or an industry benchmark.
Use AI without losing business truth
AI can help organise approved facts, draft alternatives, summarise interviews, classify enquiries, produce controlled content variants and flag missing fields. It must not invent specifications, materials, prices, discounts, stock, delivery dates, certifications, customer consent, testimonials or commercial results.
Use a four-part control:
Bound the input: provide only permitted, current source material.
Constrain the output: state what may change and what must remain exact.
Review by role: the product or commercial owner checks buying-critical facts.
Record release evidence: keep the source version, prompt or brief, reviewer, corrections and approval date.
For customer data, use approved accounts and collect only what the workflow genuinely needs. Do not paste private buyer lists, confidential price sheets or unreleased product files into an unapproved tool. India’s data-protection requirements and implementation timelines should be checked against current official MeitY material and qualified advice for the business.
Avoid the common failure patterns
Universal markup: Use product, pack, channel and risk-specific economics.
Ignoring returns and service: Use mature allowances from business records.
Competitor copying: Compare scope, quality, service, tax, freight and availability.
Uncontrolled discounts: Set floors, authority, reasons, expiry and post-sale review.
The most expensive failure is usually not weak wording. It is a mismatch between the public promise and the business that must fulfil it.
Measure progress with operating evidence
Do not use reach, clicks or message volume as proof of business value by themselves. Connect upstream activity to a verified downstream event.
Measure
Definition
Decision it supports
Realised net price
Finance-approved collected revenue per defined unit after discounts/adjustments
Whether list price reflects reality
Contribution before acquisition
Realised net revenue less defined variable costs
Whether the product can fund growth
Price exception rate
Orders outside the approved price/discount policy
Whether controls or positioning fail
Estimate-to-actual variance
Difference between quoted cost assumptions and actual outcome
Which pricing inputs need correction
Record the denominator, time window, product or offer, channel, source and owner for every rate. Keep observed results separate from forecasts. A short test can show a problem, but it may not support a broad conclusion.
A 30-day implementation plan
Days 1 to 5: define
Choose one product, audience, channel and business outcome. Complete the source-of-truth sheet, baseline and stop rules. Name the owner who can approve or stop the work.
Days 6 to 12: build
Create the smallest usable version. Test links, mobile reading, forms or message routing, exact product facts, price basis, permissions and team handoffs. Use internal testers before real buyers.
Days 13 to 20: run a bounded pilot
Release to a limited, relevant audience or product set. Log every material exception. Do not expand merely because the asset looks polished or early engagement is positive.
Days 21 to 26: reconcile
Connect platform events to enquiry, order, delivery, return and finance records as relevant. Review complaints, mismatches, duplicate handling, response delays and workload.
Days 27 to 30: decide
Choose one outcome: keep, fix, stop or expand one variable. Record why, what changes next and when the next review occurs. Expansion should preserve the same truth, consent and approval controls.
Connect this work to the GPTWala DAA framework
DAA demand generation should begin only after the business knows which exact offer can afford acquisition and fulfilment. If your product business still depends mainly on walk-ins, dealer calls, exhibitions or forwarded catalogues, GPTWala’s free DAA workshop explains how digital presence, AI-assisted content and controlled WhatsApp-led demand generation can work as one system. The workshop is educational and does not guarantee traffic, leads, orders, sales, earnings or profit.
Frequently asked questions
What is the best markup for a small product business?
There is no universal best markup. Required pricing depends on landed and variable costs, channel, returns, service, working capital, tax treatment, customer value, competition and the contribution reserve. Write the formula and scope instead of using an internet percentage.
Should online and offline prices be the same?
They may be the same or different depending on channel costs, offers, service and customer promise. Any difference should be commercially defensible and clearly presented. Avoid hidden unavoidable charges or misleading comparisons.
How often should product prices be reviewed?
Review when material costs, freight, fees, taxes, returns, exchange rates, capacity, competition, product scope or service promise change, and on a regular owner-approved schedule. Date every price book and quote.
Can a small Indian product business start a product pricing strategy without a large budget?
Yes, if it starts with one product, one audience, one owner and one measurable buyer action. A small budget does not remove the need for accurate product facts, realistic fulfilment, permission and a stop rule. Expand only after the first bounded version produces trustworthy operating evidence.
Can AI automate a product pricing strategy?
AI can assist with research organisation, drafting, classification and controlled variants. It should not invent product specifications, prices, stock, delivery promises, customer permission, testimonials or results. A named human owner must verify buying-critical facts and approve release.
How long should I test a product pricing strategy before deciding?
Use a test window long enough for the relevant outcome to mature. A product-page test may need enough qualified visits; a B2B workflow may need the full enquiry-to-decision cycle; retention work may need a repeat-purchase window. Define the event, denominator and review date before launch instead of choosing a universal number of days.